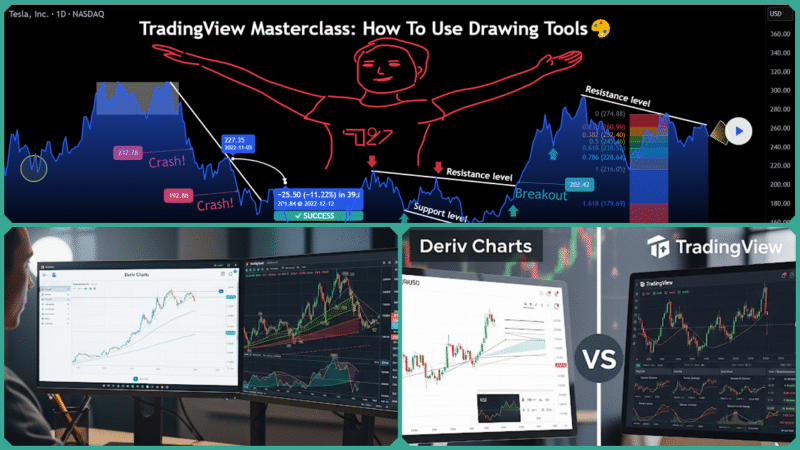
Top 9 TradingView Tools Every Deriv Trader Should Know
Estimated reading time: 16 minutes
For Deriv traders who are eager and motivated to significantly enhance their technical analysis skills and effectively capitalize on various market opportunities, mastering the right set of TradingView tools can truly be a game-changer.
TradingView, seamlessly integrated on the Deriv X platform, offers advanced and highly sophisticated charting capabilities that empower traders, particularly beginners and intermediate users, to analyze price movements with much greater precision and confidence than ever before.
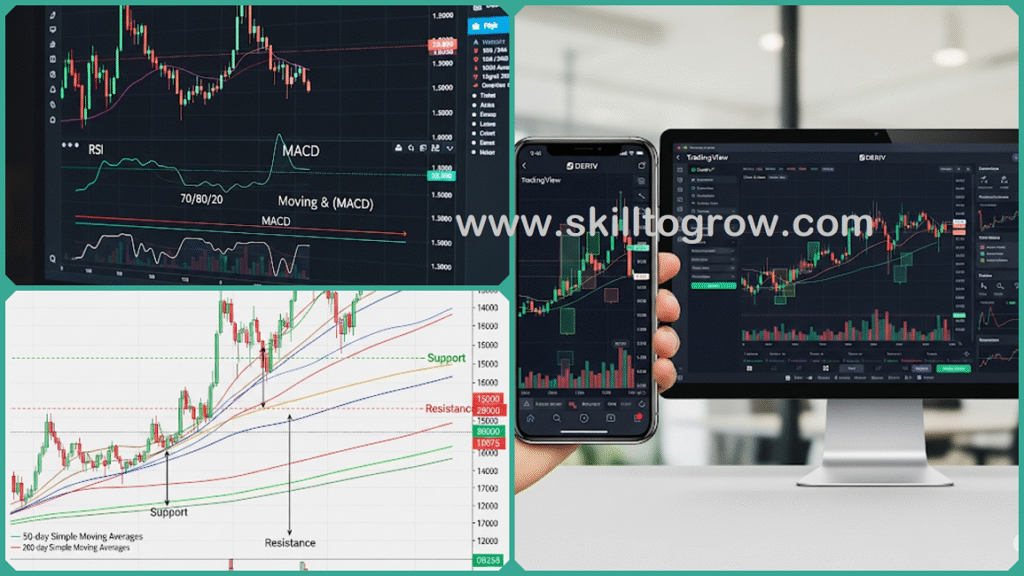
This comprehensive guide thoroughly unpacks the top 9 essential TradingView tools that every Deriv trader absolutely should know about, with the primary goal of significantly boosting strategic decision-making and enhancing overall trading efficiency in the fast-paced market environment.
Understanding TradingView and Its Importance for Deriv Traders
TradingView offers a comprehensive and powerful suite of charting tools, indicators, and drawing options that are seamlessly integrated into the Deriv platform, specifically within Deriv X. This integration enables Deriv traders to analyze a vast array of over 300 instruments, including Deriv’s proprietary Derived Indices, along with traditional markets such as forex, stocks, commodities, and cryptocurrencies—all within a single, intuitive interface.
The importance of TradingView for Deriv traders lies in its advanced capabilities that go well beyond basic charting. Traders can apply more than 100 built-in technical indicators and access over 110 smart drawing tools to annotate charts precisely.
Multiple customizable chart types and real-time market data help users identify critical trends, key support and resistance levels, and potential entry and exit points with greater accuracy. This technical depth supports informed, strategic decision-making tailored to different asset classes and trading styles, from CFDs to options and multipliers offered on Deriv.
Moreover, TradingView on Deriv X is designed for accessibility and convenience—it is available on desktop, tablets, and mobile devices without any additional cost, making advanced technical analysis tools widely available to traders regardless of experience level.
Whether a trader is carefully analyzing the volatility indices or focusing on traditional forex pairs, the integration offers a highly consolidated and efficient environment for continuously monitoring various markets and executing trades smoothly and seamlessly. This unified platform enhances the trading experience by allowing traders to manage their strategies and make informed decisions without switching between multiple tools or interfaces.
In Summary
TradingView’s seamless integration into Deriv significantly empowers traders by providing them with a richer set of analytical tools and features, greatly enhancing their overall trading experience. This integration allows traders to perform more in-depth technical analysis and market research, which in turn enables them to make more confident, informed, and timely decisions when navigating a diverse and wide range of financial markets.
The Top TradingView Tools for Deriv Traders
TradingView offers a comprehensive suite of powerful analytical and visual tools that are seamlessly integrated directly within the Deriv trading platform, with a particular focus on Deriv X. By effectively leveraging these advanced tools, traders can significantly enhance their trading strategies, improve market analysis, and make more informed, confident trading decisions.
Below, we outline the nine essential TradingView tools that every serious Deriv trader should strive to master to maximize their trading potential and success:
Trend Lines and Support/Resistance Tools
Trend lines are essential tools that help traders clearly visualize the prevailing market direction and momentum by connecting a series of higher lows during an uptrend or a sequence of lower highs in a downtrend. These lines serve as a graphical representation of the market’s overall trajectory, making it easier to identify the strength and sustainability of price movements over time.
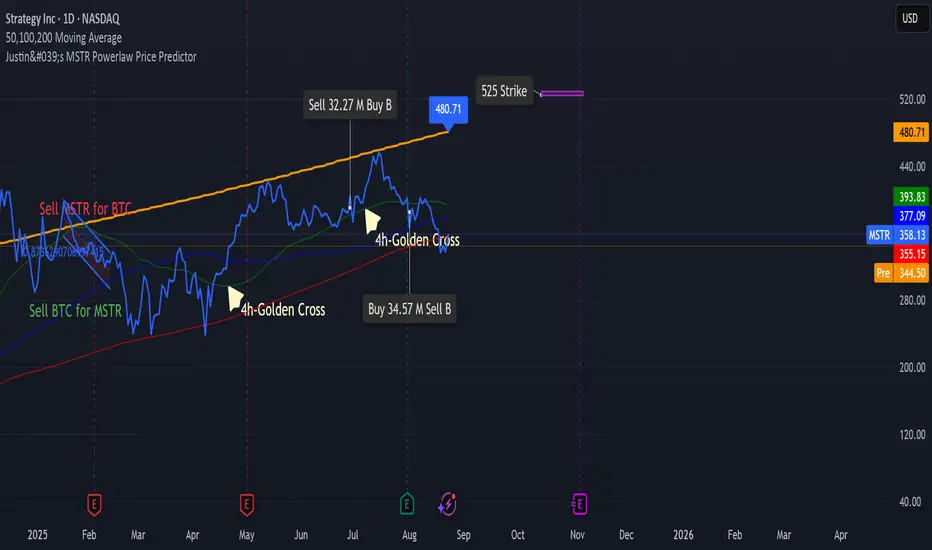
Support and resistance lines, on the other hand, mark specific price levels where the market has historically shown a tendency to reverse or consolidate, acting as psychological barriers that influence trader behavior.
By using these fundamental drawing tools, Deriv traders are empowered to anticipate potential zones of price action more accurately, which significantly enhances their ability to time entries and exits effectively, especially when trading highly volatile indices and forex pairs where price swings can be rapid and unpredictable.
Fibonacci Retracement Tool
Based on well-established Fibonacci ratios, this powerful tool helps identify likely reversal levels within a given price move, enabling traders to accurately pinpoint potential pullback zones during ongoing market trends.
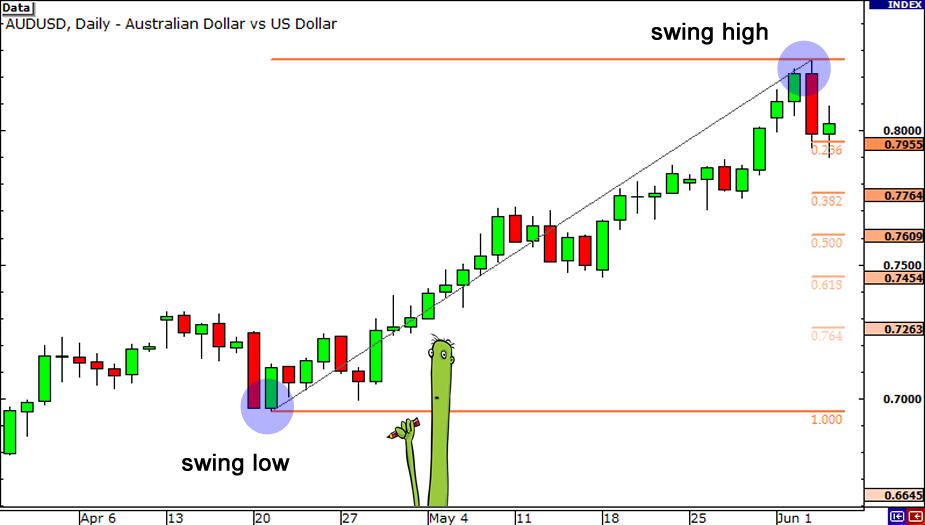
On Deriv, the Fibonacci retracement tool plays a crucial role in guiding effective trade management by suggesting optimal stop-loss and take-profit placements, especially during periods of volatile price swings across various CFDs and synthetic indices. This functionality significantly enhances risk control and improves overall trading precision.
Moving Averages (Simple and Exponential)
Moving averages serve an important function by filtering out short-term price noise, allowing traders to see clearer, underlying market trends more effectively. The Simple Moving Average (SMA) calculates the average price over a specified time period by giving equal weight to all prices within that range, providing a smooth and steady trend line.
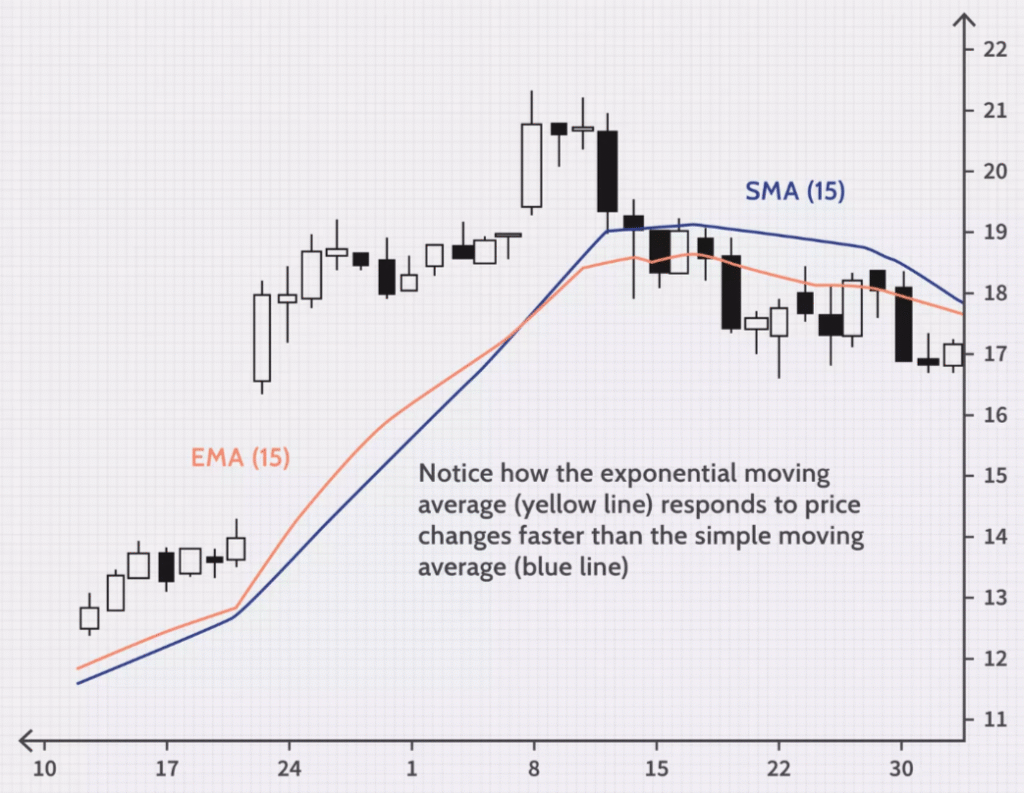
On the other hand, the Exponential Moving Average (EMA) places greater emphasis on more recent prices, which enables it to respond more quickly and sensitively to recent price changes and market movements.
Derivative traders frequently rely on these moving averages to confirm the strength and direction of trends or to identify potential trend reversals, helping them to avoid making premature entries or exits that could lead to losses.
By combining both SMAs and EMAs, traders can improve the accuracy of their signals, allowing for more refined and precise entry points when trading options and multiplier instruments, ultimately enhancing their overall trading strategy and performance.
Relative Strength Index (RSI)
RSI is a widely used momentum indicator that oscillates between the values of 0 and 100, designed to measure both the speed and the magnitude of recent price movements in the market. When the RSI readings go above the level of 70, it typically indicates overbought conditions, which often signal that a price pullback or correction is likely to occur soon.
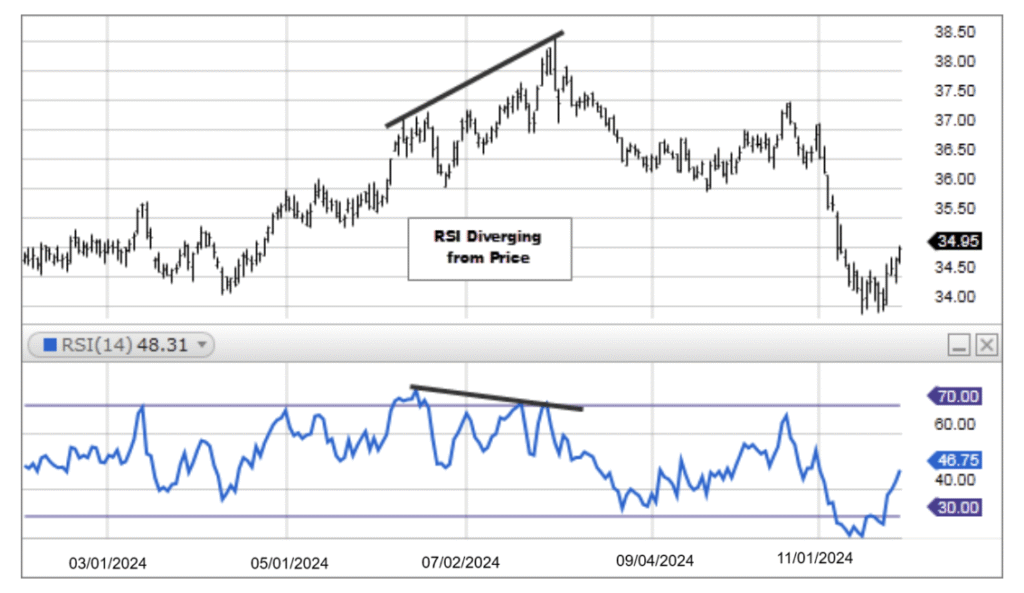
Conversely, when the RSI values drop below the threshold of 30, this strongly indicates that the asset is experiencing oversold conditions, which often points to the possibility of upcoming rebounds or notable price increases in the near future. This situation typically suggests that the selling pressure may have been overextended, creating an opportunity for prices to recover or rise.
On the Deriv platform, the RSI tool assists traders in timing their market entries and exits more effectively by helping them identify market extremes and detect divergences that are particularly relevant when trading fast-moving assets.
Moving Average Convergence Divergence (MACD)
MACD analyzes the relationship between two exponential moving averages (EMAs) to reveal momentum shifts in the market and identify potential trend reversals more accurately. The crossovers between the MACD line and the signal line generate actionable buy or sell signals that traders can use to make informed decisions.
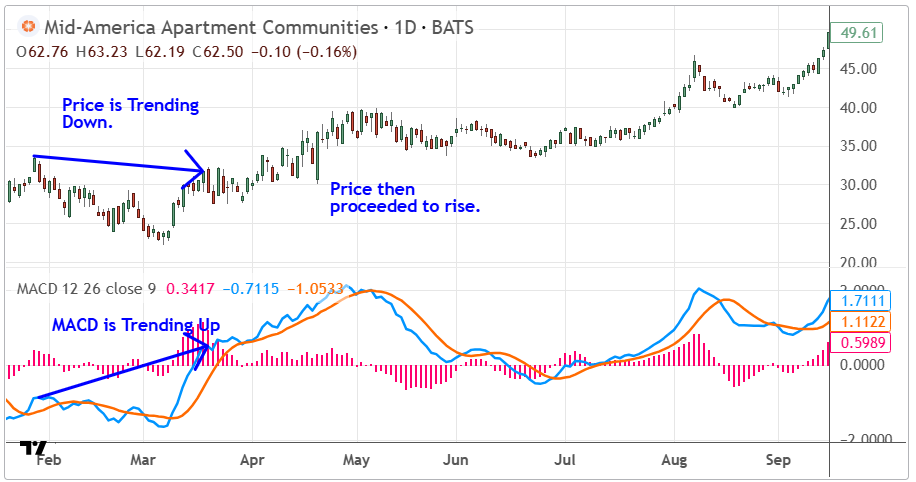
For Deriv traders who specialize in trading contracts for difference (CFDs) and options, the MACD is an essential and critical tool that helps fine-tune trade timing, ensuring that trades are better aligned with momentum surges or slowdowns in the market. This makes it easier to capitalize on market opportunities and manage risk effectively.
Bollinger Bands
Bollinger Bands are composed of a central moving average line accompanied by upper and lower bands that are plotted at specific standard deviation levels from the moving average. These bands dynamically expand when the market experiences high volatility, indicating increased price movement, and they contract during periods of consolidation when price fluctuations are minimal.
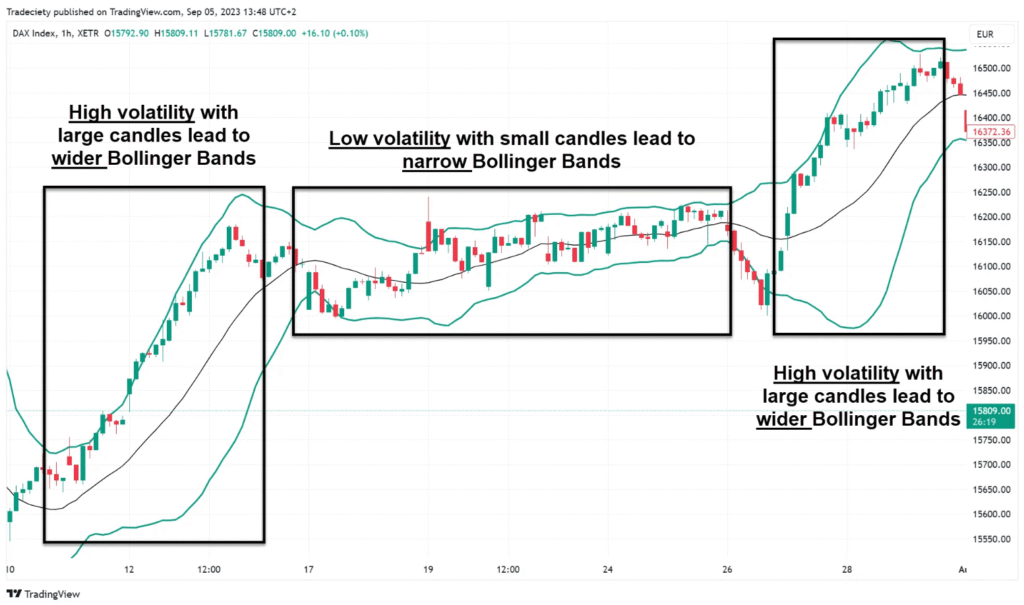
Such visual indicators offer Deriv traders highly valuable and detailed insights, significantly enhancing their ability to recognize and pinpoint potential breakout opportunities with much greater accuracy and confidence than before.
Additionally, traders can use these bands to set stop-loss orders that take into account the current market volatility, enhancing risk management strategies. The bands also assist in avoiding false trading signals that often occur during sideways or range-bound markets, thereby improving overall trading decisions.
Chart Types: Candlestick, Heikin Ashi, and Renko
TradingView offers a wide range of charting styles that are specifically designed to cater to the diverse needs of traders following different trading strategies and approaches:
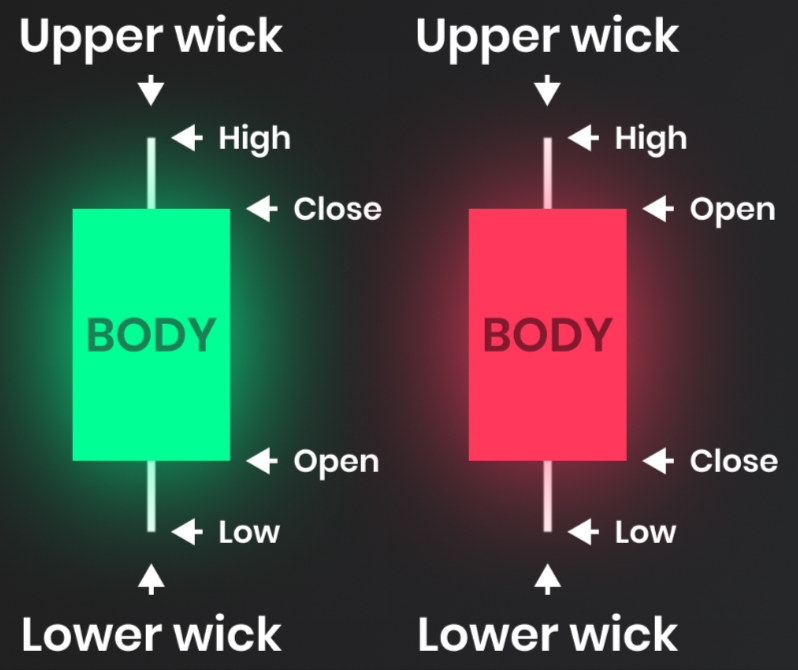
- Candlestick charts offer a comprehensive and detailed visual representation of price movements, clearly illustrating the open, high, low, and close prices for a given time period. These charts are essential tools for traders and analysts who rely on price action analysis to make informed decisions in the financial markets. By providing a clear and concise view of market sentiment and price fluctuations, candlestick charts help users better understand potential trends and reversals.
- Heikin Ashi is a technique that smooths out price fluctuations in the market, helping to clarify the overall trend direction and momentum more effectively. By filtering out market noise and minor price variations, it provides a clearer visual representation of price movements, making it easier for traders to identify sustained trends and make informed decisions. This approach reduces the impact of erratic price changes, allowing for a more consistent and reliable analysis of market behavior.
- Renko charts are specifically designed to prioritize and emphasize price movement rather than the passage of time, effectively filtering out minor and insignificant price fluctuations. This approach helps traders and analysts focus on identifying and highlighting the most significant trends in the market without being distracted by small, irrelevant price changes.
Using the most suitable and appropriate chart type available on Deriv can significantly enhance clarity and improve the overall quality of your decision-making process, especially when dealing with highly volatile Derivatives that tend to experience rapid and unpredictable price movements.
Drawing Tools: Text, Arrows, and Shapes
Beyond the basic trendlines, TradingView provides an extensive suite of advanced drawing enhancements designed to enrich the charting experience. These include text annotations that allow traders to record detailed notes or document specific trade ideas directly on the chart for easy reference later.
Additionally, there are arrows that can be used to highlight important areas or turning points on the chart, making it easier to spot critical moments at a glance. The platform also offers a variety of geometric shapes, such as rectangles, circles, and triangles, which are particularly helpful for identifying and visually organizing chart patterns.
These versatile drawing tools enable Deriv traders to structure their technical analysis clearly and systematically, facilitating the development of pattern-based trading strategies. This is especially beneficial for beginners, as it helps build confidence and improves their ability to interpret market movements through visual cues and structured analysis.
Watchlists and Alerts
Custom watchlists are essential tools that assist traders in efficiently monitoring multiple assets at the same time, allowing them to organize various instruments according to specific asset classes or particular strategy focuses.
Alerts can be carefully configured to notify users instantly of significant price movements, specific indicator conditions, or breaches of important trendlines in real time. On the Deriv platform, these advanced features help traders save a significant amount of valuable time and reduce the risk of missing critical opportunities while navigating through fast-moving and highly dynamic markets.
This carefully curated collection of 9 essential TradingView tools serves as the fundamental foundation for any Deriv trader who aims to enhance their analysis accuracy and improve trade execution skills.
By using these powerful tools together in combination, traders are empowered to identify promising trading opportunities, manage risks more effectively, and execute their trades with greater confidence and precision within the comprehensive Deriv platform ecosystem.
Current Trends and Developments in TradingView Use on Deriv
The recent integration of the TradingView advanced charting tools into Deriv X represents a major milestone and a significant advancement in trading technology for all Deriv users. This powerful integration greatly enhances traders’ analytical capabilities by providing seamless access to an extensive library of over 100 pre-built technical indicators and more than 110 highly customizable drawing tools.
With such an incredibly comprehensive and highly diverse toolkit readily available at their disposal, traders today are now empowered to perform far more detailed, accurate, and versatile chart analysis than ever before in the history of trading.
This empowerment allows them to apply sophisticated, confident, tailored trading strategies across a wide and varied range of assets, including Deriv’s unique proprietary Derived Indices, as well as popular asset classes such as forex, CFDs, and cryptocurrencies.
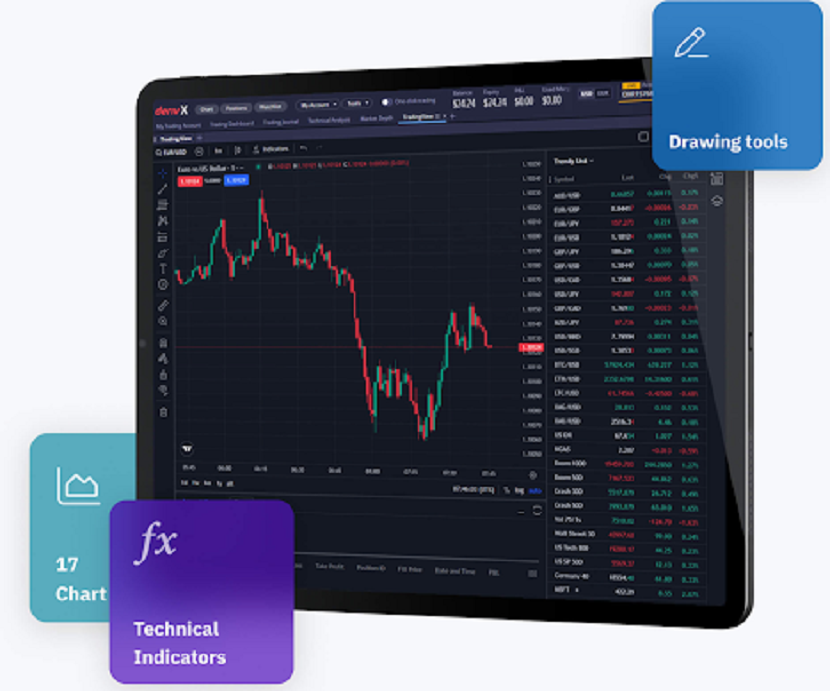
A key trend is the seamless accessibility of these tools across both desktop and mobile platforms, ensuring traders can conduct thorough technical analysis and manage trades anytime and anywhere. This mobile-friendly approach aligns with the growing demand for flexible trading solutions in today’s fast-paced markets.
Furthermore, TradingView’s integration on Deriv X goes beyond just analysis; it allows traders to place orders directly from the charts. This development simplifies the trading process by making execution faster, more intuitive, and interconnected with the analytical process. Traders can react swiftly to market movements without switching interfaces, improving efficiency and trade timing.
Deriv’s commitment to offering these advanced TradingView tools free of additional cost is part of a broader industry trend towards democratizing high-quality trading resources. By empowering retail traders worldwide with professional-grade tools, Deriv is enabling more traders to engage in the markets confidently and competitively.
Overall, the integration represents a significant shift that not only greatly enriches the user experience but also actively fosters the development of a more informed, engaged, and responsive trading community on the Deriv platform. This advancement helps create a stronger connection between users and the tools they rely on, ultimately enhancing the overall trading environment.
Real-World Applications and Case Studies
Real-world applications of TradingView tools have proven especially beneficial for Deriv traders, particularly on highly popular assets like the Volatility 75 Index. Experienced traders have successfully combined the Relative Strength Index (RSI) with the Moving Average Convergence Divergence (MACD) to identify high-probability trading opportunities.
The powerful synergy between RSI’s precise measure of market momentum and MACD’s reliable trend-following signals significantly enhances the ability to pinpoint optimal entry and exit timings with greater accuracy. This combined approach is especially crucial and beneficial when trading the fast-moving and often unpredictable volatility indices available on Deriv, where timely decisions can make a substantial difference in trading outcomes.
Another critical technique involves using Fibonacci retracement zones to set stop-loss orders effectively. By identifying key retracement levels—such as 38.2%, 50%, and the golden ratio at 61.8%—Traders assess potential areas of support or resistance where price reversals or consolidations may occur. Placing stop-loss orders just beyond these retracement zones allows for minimizing risk during volatile market swings, protecting capital while allowing room for normal price fluctuations.
On the Volatility 75 Index, for instance, applying Fibonacci retracement on the 1-hour chart is recommended to define precise stop-loss and take-profit zones, improving risk management and overall trade success.
Moreover, many Deriv users report increased confidence and enhanced trading performance after incorporating TradingView’s full suite of tools into their daily routines. The combination of watchlists and alerts plays a vital role here by enabling traders to remain proactive in swift markets.
Traders can monitor multiple instruments, receive timely notifications on price movements or indicator signals, and react quickly to emerging trading opportunities without constantly being glued to their screens.
In essence, the practical application and effective use of TradingView tools—especially key indicators such as RSI, MACD, Fibonacci retracements, along with watchlists and customizable alerts—greatly enhance Deriv traders’ overall ability to manage risk more efficiently, precisely time their trades, and maintain a higher degree of control when navigating through the often volatile and unpredictable markets like the Derived Indices.
These tools collectively empower traders to make significantly more informed and well-considered decisions, allowing them to respond and adapt quickly and efficiently to rapidly changing and often unpredictable market conditions.
FAQs
Can beginners easily use TradingView tools on Deriv?
TradingView tools on Deriv are designed with user-friendly interfaces that allow beginners to quickly learn and apply essential analysis techniques. With intuitive chart layouts, built-in tutorials, and demo accounts available on Deriv X, new traders can practice risk-free and gradually build their technical skills confidently.
Are TradingView charts free to use on Deriv?
All TradingView charts, technical indicators, drawing tools, and features integrated into Deriv are available at no additional cost to users. Traders can access the full suite of advanced charting tools within Deriv X without any subscription fees or hidden charges.
Can I place trades directly from TradingView charts on Deriv?
Deriv X enables traders to place buy and sell orders straight from the TradingView charts interface. This direct trading feature streamlines execution, allowing users to act quickly on market signals without switching between different windows or platforms.
Which indicators are best for trading Derived Indices on Deriv?
Popular indicators for trading Deriv’s Derived Indices include the Relative Strength Index (RSI), Moving Average Convergence Divergence (MACD), various Moving Averages (Simple and Exponential), and Bollinger Bands. These indicators provide valuable insights into momentum, trend direction, volatility, and potential reversal points critical for success in synthetic indices trading.
Is TradingView available on mobile for Deriv users?
The full TradingView integration on Deriv X is accessible on both desktop and mobile platforms. This cross-device availability allows traders to monitor markets, analyze charts, and place trades on the go, providing flexibility and convenience.
In Conclusion
Mastering TradingView tools is a crucial step for Deriv traders who want to elevate their technical analysis skills and improve their trading outcomes. From fundamental drawing tools like trend lines to more advanced indicators like the
- Moving Average Convergence Divergence (MACD)
- Relative Strength Index (RSI)
These nine essential tools form a comprehensive and powerful toolkit every trader should harness. Their combined use empowers traders to spot trends, gauge momentum, and identify precise entry and exit points more confidently.
Coupled with real-time alerts and customizable watchlists, TradingView on Deriv X transforms the overall trading experience by making analysis, decision-making, and order execution smoother and more precise. Traders benefit from seamless integration, with the ability to place trades directly from chart interfaces, saving critical time and reducing friction.
Deriv’s proactive approach to integrating these advanced, professional-grade TradingView tools at no extra cost demonstrates a commitment to democratizing high-quality trading resources for retail traders globally. These features cater to both beginners and experienced traders alike, enabling them to adopt a modern, efficient trading workflow.
To truly trade smarter and with greater confidence, Deriv traders should actively explore and familiarize themselves with these TradingView tools today. Embracing these capabilities not only enhances trading accuracy but also builds a strategic mindset necessary for long-term success in the dynamic financial markets.
Discover more from Skill to Grow
Subscribe to get the latest posts sent to your email.


